
OpenAVMKit: a Free and Open Source mass appraisal library
You provide the data and the modeling decisions, we provide the tools

Today we are launching OpenAVMKit, a new free and open source library for real estate mass appraisal. We built this to power not just our own analysis work, but to share with everyone in the world under a free and open source license.
We were specifically inspired by the Cook County Assessor’s Office Github, which is the best open source AVM library available to date. Their work is and remains fantastic, but is hard-wired to the exact needs of Cook County. OpenAVMKit was designed to produce similar functionality that can be configured for any jurisdiction.
We would like to extend our deepest thanks to our two chief sponsors: Scott Alexander and his Astral Codex Ten grants program, who provided our initial funding, as well as Joshua Vincent and the Center for the Study of Economics. OpenAVMKit would not have been possible without them.
A Quick Taste
You can use OpenAVMKit to build powerful AVMs, among other tasks. As an example, we made a single family residential model composed entirely from open data sources, particularly the assessment data provided by Guilford County, North Carolina’s open data portal. We loaded their data, cleaned it, enriched it with millions of new data points from publicly available data sources, then tested against IAAO standards and the existing assessor’s values.
Here’s a quick example of the results we were able to achieve.
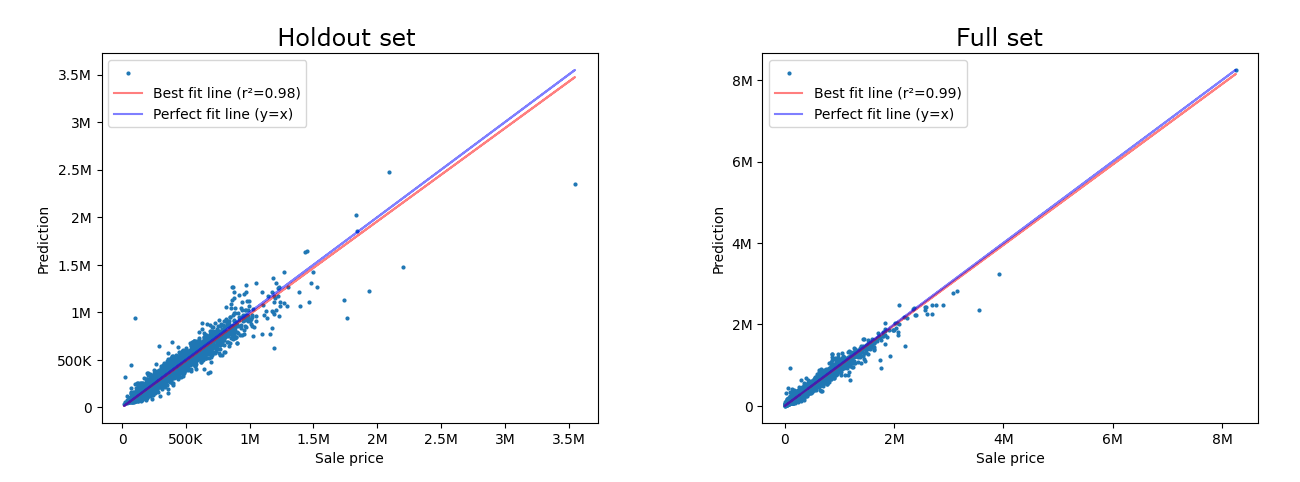
Graphs:
These graphs compare our predicted price to the actual observed selling price. A theoretically “perfect” prediction would have every value lie along the blue line. The red line represents the “best fit” linear regression of our own predictions against the observed sales. We can visualize the accuracy of our model by seeing how close the red line gets to the blue line, as well as the overall spread of individual dots on either side of the lines.
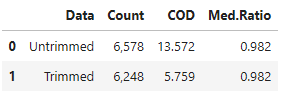
Statistics:
Another way to evaluate our score is to look at our statistics. If you don’t know what these mean, review Mass Appraisal for the Masses. The bottom line is that for a single family model, the IAAO standard on ratio study recommends a median ratio within a few hundredths of 1.00, and a COD below 15. Our model exceeds those standards.
Full set, untrimmed:
Median ratio: 1.00
COD: 6.05
PRD: 1.02
# samples: 26,148
Holdout set, untrimmed:
Median ratio: 0.99
COD: 11.88
PRD: 1.01
# samples: 5,137
Horizontal uniformity:
Median CHD: 11.6
How’s Guilford county doing by comparison? Well, they’re on a multi-year reappraisal cycle and not due to update their values until 2026, so a truly fair apples-to-apples comparison would require us to run a 2022 AVM to compare against theirs; our above values are for 2025. In an upcoming article we’ll show you how to deal with these kind of situations in OpenAVMKit by setting custom valuation dates, but even if we can’t compare our results head-to-head right this second, we can still run a quick ratio study of Guilford’s 2022 valuations against sales from one year prior:
Guilford passes the COD and median ratio tests even on the untrimmed dataset. This is another reason Guilford is an attractive dataset; the official assessments are of good quality.
The Open Data Revolution
Something curious has happened over the last few years. If you go and check your own local government’s website, there’s a better than even chance that there will be an “open data” portal posted there, with surprisingly high quality and well organized public data. Anyone can take this data and analyze it, but what’s generally been lacking is the technology, tools, and training to do so. We intend to close that gap when it comes to real estate mass appraisal, with OpenAVMKit and this blog as key parts of that.
Case in point—it wouldn’t be very useful to launch a data analysis toolkit without an example dataset to play with, so we built one based on Guilford county. Why did we pick Guilford county? Because they had a great open data portal, which I discovered while working on some other counties in the area. We intend to add more as time goes on, and we’d be happy to take suggestions and submissions from you!
NOTE: Guilford county has no official relationship with the Center for Land Economics. They just provided excellent data to the public, and we happened to use it. We thank them.
Free and Open Source
OpenAVMKit is “free as in beer” as well as “free as in speech.”

That means two things:
You don’t have to pay any money to use it
You are free to copy, modify, use, and even sell the software as you see fit for any purpose without having to ask our permission first
The only restriction is that you must publicly share any changes you make to the software’s code under the same license terms. You can find the full reasoning behind this here.
Where can I get OpenAVMKit?
Go to OpenAVMKit.com and follow the instructions. Alternatively, you can visit the Github page.
To set expectations: this software should be considered “beta” quality so please pardon our dust as we fix bugs and make general improvements; the version number currently sits at 0.2.0 to reflect this early state. We’re going to follow up today’s launch with a steady stream of examples, tutorials, and other articles over the coming weeks and months. Once we have ironed out all the kinks and the library is fully mature, and is properly supported with basic educational resources and battle-testing from a few users who aren’t us, we will re-launch it as version 1.0.0.
What can OpenAVMKit do?
A lot of stuff. Here’s a short list:
Test the quality of existing assessments
Enrich datasets with open source data
Organize, clean & validate datasets
Build and evaluate Automated Valuation Models (AVMs)
Export clean and standardized reports
Lots of other things
Who is OpenAVMKit for?
OpenAVMKit is an open source code library for the Python programming language.
We expect its earliest adopters will be fairly tech-savvy people, such as researchers, policy analysts, as well as assessors and appraisers who have some modeling or scripting skills. This leaves a gap for the many people in the assessment field who would love to use these features but who lack the technical training to do so.
That’s exactly why we made our toolkit open source. We want to encourage those with the proper resources and skills to take what they see, build upon it, and share it with the world just as we have. We figure that with enough time and effort, we can eventually close the accessibility gap.
If you’re interested in building on top of OpenAVMKit, you can literally start right away—it’s free and open source! If you are interested in working with Greg and I directly, or have a specific idea you want to ask us about, please get in touch with us at the Center for Land Economics.
Also, if you’d like to join the OpenAVMKit community, feel free to hang out with us on our Discord Channel.
Now let’s take a brief tour of some of the things you can do with OpenAVMKit.
Test the quality of existing assessments
Remember all those tests we talked about in Mass Appraisal for the Masses? You can do all of them with OpenAVMKit. So if you were curious about how your local government’s results stack up, we give you all the tools you need to be able to reproduce the same statistical tests that your state oversight body will likely run against them. Obviously, you can use these same tests to evaluate your own AVM results as well. All you need is data.
Enrich datasets with open source data
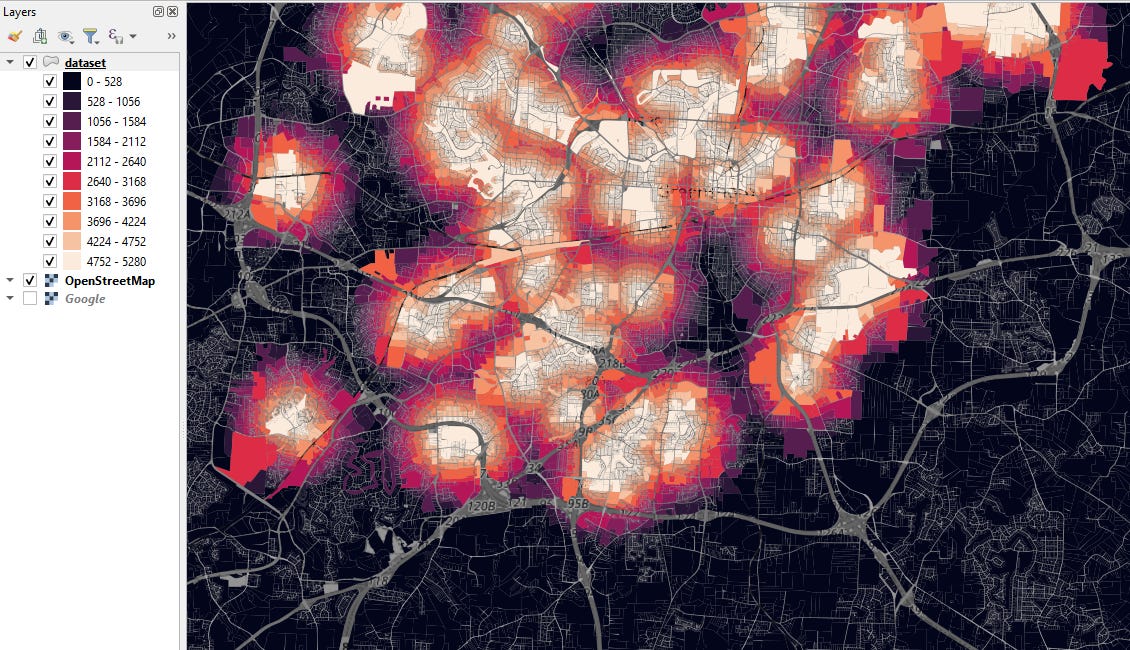
OpenAVMKit can add lots of data from easily available sources. Here’s a few examples.
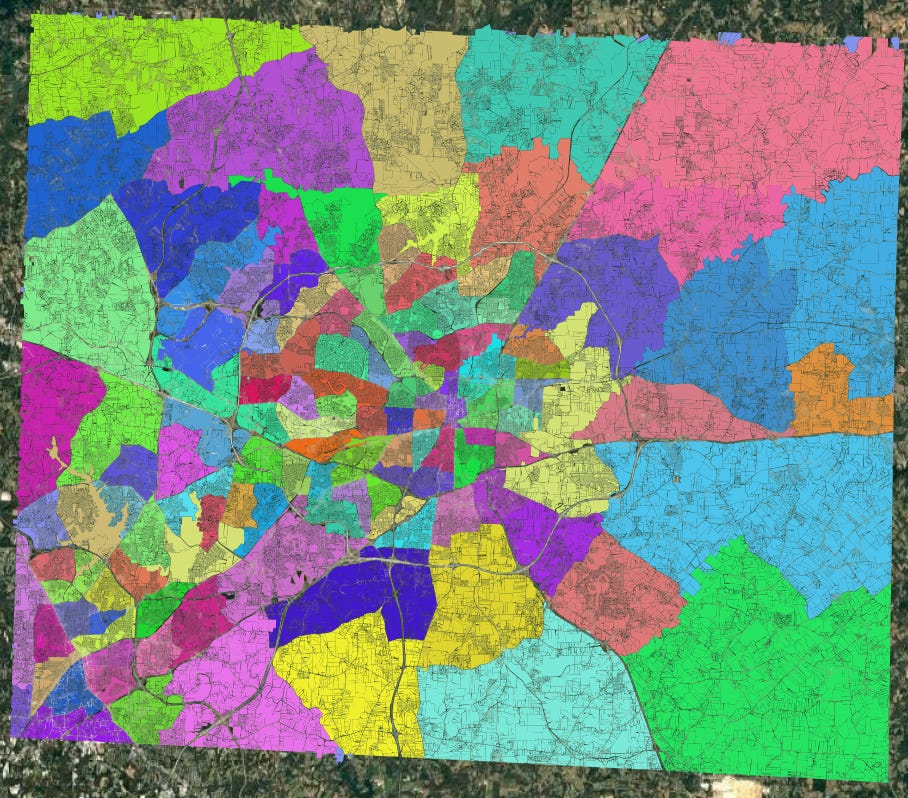
You can tag every parcel in your dataset with its proximity to features like golf courses, universities, lakes, parks, or anything else want. You can define your own shapefiles, or you can download them automatically from Open Street Map. Here’s a map visualization of a surface painted with proximity1 of every parcel to the closest park:
You can also stamp your own shapefiles and any characteristics associated with them, directly onto your individuals parcels. This is particularly useful for e.g., zoning overlays, school districts, and census tracts:
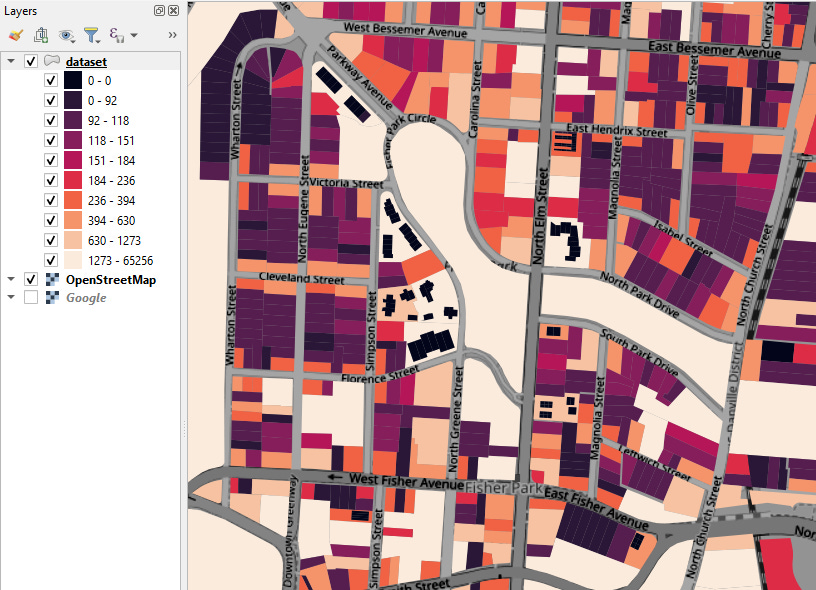
You can calculate the frontage and depth on all sides of every parcel against every adjacent street, even if they’re curved. (NOTE: this is very computationally expensive!)
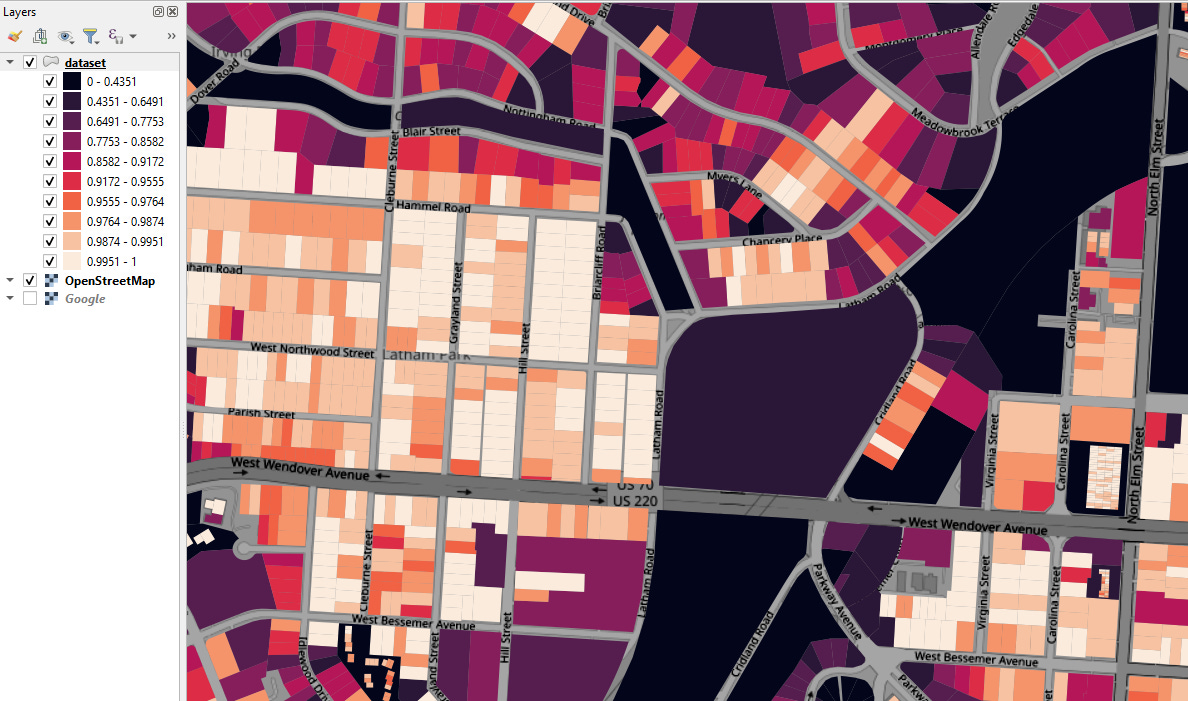
You can automatically calculate each parcel’s shape and note how close it is to a perfect rectangle:
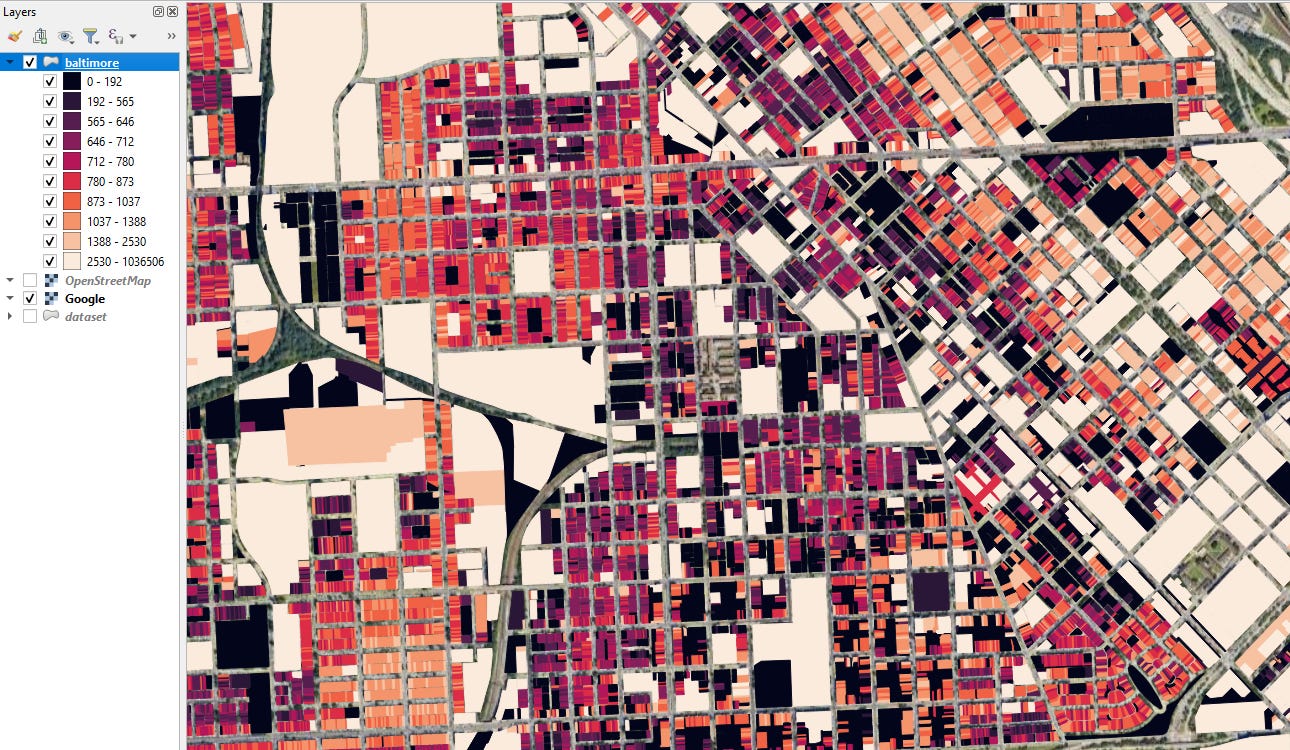
You can fill in missing building footprint data using the Overture dataset, which is a free open dataset of building footprints derived from available satellite imagery data, and further use that data to infer correlated characteristics that are otherwise missing in your dataset. We used this in Baltimore to fill in large swaths of the dataset where the size of buildings was missing:
Are there other data enrichment options you think we should have? Feel free to suggest them, or write them yourself and open a pull request!
Organize, clean and validate Datasets
The basic idea is to reduce a series of complex, tedious, and error-prone transformations into a set of declarative statements in a settings file. Describe what you want to do once, and you can rebuild your entire dataset from scratch anytime.
You can either bring your own data, or you can connect to open API’s like the US Census, OpenStreetMap, or Overture, or you can do both.
Then, instead of having to maintain a bunch of one-off merging and spatial join code, you just gather your custom shapefiles in a folder, and declare what joins and enrichments you’d like to do in your settings file. Then you run through the standard OpenAVMKit pipeline which reads your data and settings file, and it does all the things, including being fastidious about important details like coordinate reference systems.
OpenAVMKit loads all your initial data files from whatever sources you define (CSV’s, ESRI shapefiles, Geopackages, Parquets, etc.), merges them together, and alerts you if you’re missing anything essential.
It also has tools for enforcing certain best practices (such as carefully maintaining a separate sales transaction dataset and parcel universe dataset), and makes it easy to ensure that all your fields are the right type so that you can avoid problems down the line.
Once your data is loaded, you can use OpenAVMKit to clean that data with filters, organize the data into individual model groups (such as “single family” vs. “townhomes” vs. “commercial”, etc.), and then run basic sales validation heuristics, as we described in Amateurs talk Algorithms, Professionals talk Data cleaning.
Finally, if your dataset is missing certain data, you can specify what rules you will use to fill those blanks prior to building a predictive model.
This all adds up to a pipeline that not only simplifies the process of building and maintaining your dataset, but also makes it transparent, auditable, and reproducible. Every step you take is committed to data.
Build and evaluate Automated Valuation Models
Automated Valuation Models are the “AVM” in OpenAVMKit, which are basically just fancy algorithms that predict the price of real estate based on historical transactions and parcel characteristics. OpenAVMKit does a few things to help you do build these.
First, it enforces certain best practices to ensure that your data is properly set up.
Second, it provides a standardized interface for running the same data through a bunch of different algorithms at once. These algorithms were all originally written by different people and each is invoked in its own unique way, so we put a standardized wrapper on top that lets you skip all the tedious work. You just say “give me LightGBM”, or “give me XGBoost” and it will just be taken care of.
Third, it provides an end-to-end jupyter notebook pipeline that first assembles your data, then cleans it, then hands it off to the modeling engine, running checks along the way and raising warnings and errors as necessary to help guide you. You provide data and settings. You don’t have to directly write any python code yourself unless you want to go “off-road.”
Fourth, it provides sensible defaults that tune all of this stuff for the specific task of real estate valuation.
Fifth, it provides variable significance testing, so you can play around with variables and identify which ones are the most likely to improve your models, before you actually build any models.
Sixth, it generates both statistics and graphs to help you evaluate your results and understand how different variables contribute value to your model.
Seventh, it provides automated models ensembles, which combine the results of multiple individual models to get better performance.
Eighth, it provides tools specifically for the valuation of land. (We’ll have an entire article on this later).
Now, all this said—AVM’s cannot spin straw into gold. If you have excellent data, an AVM can get excellent results. If you have garbage data, an AVM will get garbage results. A key skill we’ll be writing about in the future is what kind of data is necessary, and how to collect it. The number one way that jurisdictions can improve their results in the future is simply by collecting and cleaning the right data.
Please Join Us!
We don’t believe that we can do this entirely by ourselves, nor that AVM’s will magically solve all of our problems overnight.
But we do believe that everyone should have access to the best modern mass appraisal technologies, and that if we all work together, we can complement the open data revolution in local government with an open software revolution.
The future is open, and it looks bright.
Lars Doucet is the author of Land is a Big Deal co-founder of the Center for Land Economics, and chief maintainer of OpenAVMKit.
“Proximity” in this context is a special measure of “distance” that is restructured in a way to make it more useful to regression analysis. Basically, we cap the distance at a maximum amount and invert it, so the number gets bigger the closer you are to the thing, and then fades to 0 as you approach a maximum distance away from it.
Wow!
Super excited to see this post, specially as I've just spent the last week testing the library, and it's been awesome.
Also, I can attest that it can get quite computationally expensive, so the upcoming examples will be quite welcome.
Currently I've been running the test data (guilford-nc, downloades from Hugging Face) locally on my laptop. What are the hardware requirements (RAM, CPU) that would be recommended for running the test data?
I was discussing (debating) Georgism with a friend recently who kept advocating for investment opportunities in land along side things like company stock. My takeaway (which I’d love to see @Lars Doucet and @Greg Miller flesh out) is that having individuals invest in and benefit from increasing land values is bad for society whereas increasing stock values are good for society. We need a wholesale mind-shift to a world that advocates for cheaper costs to use land. The land can still be valuable but the cost to access the land needs to go down over time. In this world, homelessness decreases with time (more market-rate cheap housing available), poverty goes down (poor people spend less time traveling to jobs), etc.