
You Can Now Vibe Code Land Value Tax Modeling
New agent skills in LVTShift run the whole pipeline — data, legal pathway, modeling, and graphics — from a single command.

Land value taxes are easier to model than ever, and now AI agents can do most of the driving with new updates to LVTShift, an open-source coding repository maintained by us at the Center for Land Economics.
In its output, you can get parcel-level impacts comparing a land value tax to traditional property taxes with visualizations such as this:

The process to producing such a visual requires a lot of steps. You have to find and pull the assessment data, sometimes from several sources, and stitch it all together. You have to interpret that data, including classifying each property by type. Then you must apply the millage rates and rebuild the existing property tax system in full, with all of its assessment ratios, circuit breakers, and exemptions (both full and partial). Only then can you model a new rate under a proposed split-rate policy, and finally analyze and visualize who is affected: which property categories gain, which lose, which neighborhoods, and how the impact falls across income levels. It is a long process.
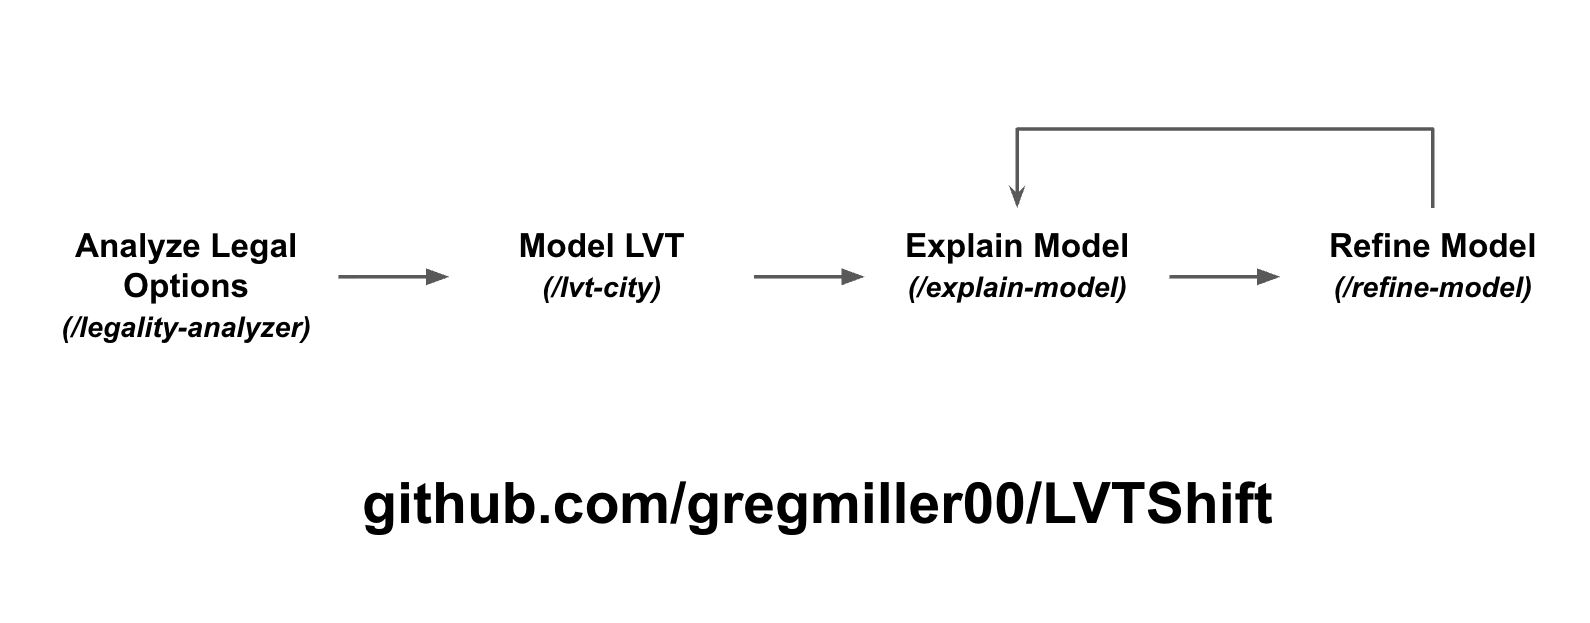
Now the whole process runs from a single command: /lvt-city <city>. And that is just the start. I’ve updated the LVTShift repo with a handful of skills for modeling LVT:
/legality-analyzer <place>: maps the legal pathway to LVT in a given city or state, grounded in the actual constitution, statutes, and case law, and lays out which reform vehicles (split-rate, building exemption, classification, and so on) are open.
/lvt-city <city>: runs the whole pipeline end to end. It finds the data, rebuilds the current tax, models your proposed policy, and produces the parcel-level results and graphics.
/explain-model <city>: writes a plain-language methodology audit of an existing model, covering what data it used, which levies it did and did not include, how exemptions were applied, and where its limits are.
/refine-model <city>: re-runs an existing model with different parameters, like a new split ratio, a switch to a building exemption, a different exemption treatment, or a wider set of levies.
This is the first step toward a set of agentic tools at the Center for Land Economics. Lars and I have been working to make our capabilities and knowledge easier to reach for LVT advocates everywhere, and not just with this launch. It is how we think about our work as a whole, so you can expect us to keep lowering the barrier to doing real LVT advocacy in local communities.
What is LVTShift?
Last year I launched LVTShift, an open-source toolkit for modeling land value taxes in local jurisdictions. The codebase was a little rough, but the point of releasing it, along with the article that went with it, was to show my work: the thinking and the code behind modeling a property tax shift in a specific place.
That original article is still worth reading, because the agents in the new LVTShift follow the same steps. The coding agent will also output a python notebook that still looks quite similar to the python notebooks I was creating a year ago. This is a subtle, but important, point to those less-technical: the AI is not doing something mysterious. It is writing the software that does the modeling, and the results are deterministic, so they do not change from one run to the next.
Since that article, I continued using the repo to model new cities, and my process changed a little each time as the coding agents got better. For the past few months I have been almost exclusively using agentic coding tools for modeling land value tax shifts.
As such, I have subscribed to the belief that markdown files are code. This newer version of LVTShift is really just a few markdown files plus some utility functions. Or, in other words, enjoy my prompts…
They have been very useful in my own work, so I expect it will help others too.
How to get started
The repo is built to be driven by a coding agent in plain English, so most of the setup is something you can hand to the agent itself. This also means you do not need to be technical to get started; you just need a Claude Code, Codex, or similar subscription. LVTShift is built around Claude Code, which is where the slash commands like /lvt-city live, but Codex will work too.
Once you are in the coding agent, clone the repo from github.com/gregmiller00/LVTShift and let the agent install its Python dependencies for you. If you have never touched Python, that is fine; “set this repo up and install the requirements” with a link to the repo is a perfectly good thing to say to the agent.
Then, get a free Census API key. This is the one step that is truly yours to do. Sign up at api.census.gov, copy the key into a .env file, and you are set. The model uses it to pull neighborhood income and demographic data. Again, the coding agent can take you through this.
Then, start with the commands. You can type /lvt-city <your city>, answer the five questions it asks (which levy, which reform, whether to keep existing exemptions, your county and state, and an official revenue figure to check against), and wait.
What will LVTShift produce?
Last week I released a report, “Tax Land, Not Homes: A Revenue-Neutral Path to Unlock Spokane’s Underused Land,” which modeled a partial land value tax in Spokane through a universal building exemption.
Why a universal building exemption? Because Washington’s constitution will not let you tax land and buildings as two separate classes, but it does give the state broad authority to exempt property from taxation. This is where I think a lot of analysis should start: find the lowest-hanging fruit, politically, for shifting the tax burden onto land. The /legality-analyzer skill is built to help with that. Typing /legality-analyzer Spokane surfaces the building-exemption pathway and the legal reasoning behind it.
From there you run the model with /lvt-city Spokane. You can add detail up front, like /lvt-city Spokane with a 50% building exemption, or just let the agent ask you as it goes.
Within about an hour you will have a set of outputs. The first is a CSV listing every parcel, its current tax (as rebuilt by the model) and its new tax under the proposed policy. Alongside that you will get a series of graphics. The graphics will be styled differently, but they will contain similar information to the following graphics in the Spokane report.
Impact by property category
The first shows the net change by property category, scaled to the median parcel so a handful of outliers cannot distort the picture. In Spokane, the building exemption moves the burden onto the land that is doing the least work. Vacant lots see a median increase of about 118% and surface parking about 112%, and together they account for most of the shifted revenue. Every residential category pays less, with large multifamily buildings of five or more units seeing the biggest median cut at roughly 14%.
The modeling will show: net change (the total dollar amount +/- of that property category), the median dollar amount, the median percentage change, and the number of parcels.
How widely the change is felt
The next graphic asks not how big the typical change is, but how many parcels move by a lot. If the median single family house were to increase, but no single family house moves more than +/- 10%, then really most are seeing no significant change to their property tax bill.
Nearly every vacant land and parking parcel, 99% and 96% respectively, sees an increase of more than 10%. The ones that do not are merely assessor categorization errors, or are parking garages. The large decreases, on the other hand, are concentrated in multifamily housing: 65% of large multifamily and 47% of small multifamily parcels drop by more than 10%.

Who benefits, by income
It is also important to know whether the policy is progressive. To do this, we merge parcel data to census geographies and data. You will need a Census API key, but that takes less than one minute to get, and your coding agent should take you through that.
Once the model joins each parcel to census block group income data, we can also see how the relief is distributed. Among residential, non-vacant parcels, the median tax cut is largest in the lowest-income neighborhoods, about 5% in the bottom quintile, and smallest in the highest-income ones, about 1%. In other words, the cut is progressive. This graphic restricts to non-vacant, residential parcels because that is typically what people care about when they ask: is this policy going to evict low-income homeowners?

Who benefits, by neighborhood
A similar pattern holds when you look at neighborhood demographics. Median residential tax reductions generally grow as a neighborhood’s minority population share rises, from about 3% in the least diverse quintile to between 4 and 4.5% in the most diverse.

“The results for my city don’t look politically good”
That happens, and it is worth saying plainly what “not good” usually looks like: single-family homeowners seeing a big increase, or low-income neighborhoods taking the hardest hit. If that is what your first model shows, here are a few things to keep in mind.
First, you can try a different policy. A 2:1 or 4:1 split instead of a full shift. If you are doing an exemption approach, a flat exemption on the first $100,000 of building value can change the picture a lot.
Second, you can model tax districts, rather than doing a city-wide shift. Often the goal of a land value tax shift is to bring a downtown back to life, and downtowns are exactly where land values are highest, so that is where the shift does the most work. Drawing the policy around the downtown corridor concentrates the benefit where it matters and keeps it off the parcels you are worried about.
Third, even “only okay” results are better than they look on the page. These models cover the tax bills of people who own land. In a lot of cities that leaves out the 40% of residents who are renters and own no land at all. Renters gain from this policy overall, especially as more housing brings down rents.
In addition, perhaps more importantly, this modeling is the one-time static impact of tax bills. The purpose of a land value tax shift is not for tax redistribution. It is meant to long-run encourage development while ensuring a balanced local budget.
What about Agriculture?
I usually leave agriculture out of the analysis. On farmland, much of the value sits in the land itself, since the “improvements” are often things done directly to the soil, so assessments tend to show high land values. That means an LVT shift tends to raise the tax burden on ag land, which makes a proposal harder to pass. Urban land is where values are highest and where the shift goes furthest anyway, so that is where I prefer to focus. It is a preference, though, not a hard rule.
How do I know if my city’s land values are good?
Good question, and one we are building more material to answer. In the meantime, I recommend reading Lars’ article on land valuation to understand the theory on what good values would look like. Until there is a full set of tests, here is what to look for:
First, has your city completed a revaluation recently? If it’s been a while then the valuations may not be reliable.
Second, look at the land values. Do they make intuitive sense? Do the areas you know to be the most valuable have higher land values? Do the poorer areas have lower land values?
Third, are land values locally flat, or is there tons of side-by-side variation? You don’t expect them to be perfectly smooth, but if they’re very noisy, that’s surprising.
Fourth, do land values spike where we naturally expect them to—along transit corridors, along commercial corridors, in the city center, in wealthy neighborhoods, along premium waterfront, along golf courses, etc?
What do I do with this modeling?
The modeling should serve as the data behind the work you do, but data alone does not change minds. You will need to pair the data with story-telling, as well as coalition building and elite persuasion. We have written a playbook on steps to advocating for land value taxes in your local area, and it should serve as a good guiding point.
The repo is a starting point
All of this is a starting point. Have a question? Want to model something different, or see a new kind of graphic? Ask your coding agent.
And if you have ideas for improving the skills, find yourself correcting the agent over and over, or want a skill that does not exist yet, let me know or open a PR.
I'm going to try and vibe code this for use with a French city, wish me luck 😆
Excellent 👍