
How replacing council tax with a flat land value tax would affect households in the UK
New PolicyEngine modeling on a revenue-neutral swap: scrap council tax, tax land instead. Most households gain; poverty edges down.


Guest post from Vahid Ahmadi and Max Ghenis of PolicyEngine
We used PolicyEngine UK, our open-source model of the UK tax-and-benefit system, to ask a question: what would happen if Britain scrapped council tax and replaced it with a flat tax on the value of land?
At the rate that raises the same revenue — 0.77% of land value, which we derive below — the switch leaves most households better off. In fact, the average household in every income decile from the poorest up to the eighth comes out ahead; only the top two deciles pay more. Poverty edges down. Yet measured income inequality barely moves, because the tax falls on land wealth, which doesn’t track income neatly. The sharper story is on the wealth axis: wealth is far more unequally held than income (a Gini of 0.70 against 0.37), and the burden rises with wealth, falling mainly on the wealthiest households. Sorting out why broad household gains sit alongside a near-flat income Gini is much of what this post is about.
Below we explain how council tax works today, how we estimated every household’s land, and why these headline numbers need careful interpretation.
How council tax works today
Council tax was introduced under time pressure. It replaced Margaret Thatcher’s poll tax, which had collapsed amid riots and mass non-payment: the Local Government Finance Act 1992 brought it into force on 1 April 1993, leaving valuers about two years to place every home in Great Britain — more than 20 million properties — into a band.
To meet that deadline, the Inland Revenue’s Valuation Office and the Scottish Assessors brought in estate agents to band properties quickly, in some cases assessing them from a moving car — a practice later nicknamed “second-gear valuations.” Each home was placed in one of eight bands, with the top band in England, Band H, covering every property worth £320,000 or more at 1991 values.
Those 1991 valuations remain in force today. England and Scotland have never been revalued — the government shelved a planned 2007 revaluation that was never carried out — while Wales rebanded in 2005 and Northern Ireland uses a separate domestic rates system. The freeze has an important consequence: because the top band has no ceiling above £320,000, a £400,000 home and a £4 million home can sit in the same band and pay almost the same, so council tax represents a smaller share of a property’s value the more it is worth. This regressivity has prompted reform proposals — from the Mirrlees Review and the Institute for Fiscal Studies to John Muellbauer and the Fairer Share campaign — to tie property taxes more closely to current values.
A few figures set the scene. The Office of Budget Responsibility forecasts Council Tax to raise £53.7 billion across Great Britain in 2026-27. Low-income households can claim Council Tax Reduction (CTR), a means-tested rebate that lowers their bill; local authorities in England design their own schemes, while the Scottish and Welsh governments set national ones. Northern Ireland again sits outside this system, with its own domestic rates, which this analysis leaves unchanged.
This post simulates replacing council tax with a flat land value tax (LVT) that raises the same revenue. Importantly, the land tax isn’t calculated from the frozen 1991 council-tax bands — it’s based on estimates of what land is worth today, built from each household’s current property value (drawn from the Office of National Statistics’ Wealth and Assets Survey) and calibrated to the ONS’s official national land-value total. We then report the household-level impact at the budget-neutral rate.
What we find
The UK could replace council tax with a budget-neutral 0.77% LVT on its £7.5 trillion of land value (ONS National Balance Sheet).
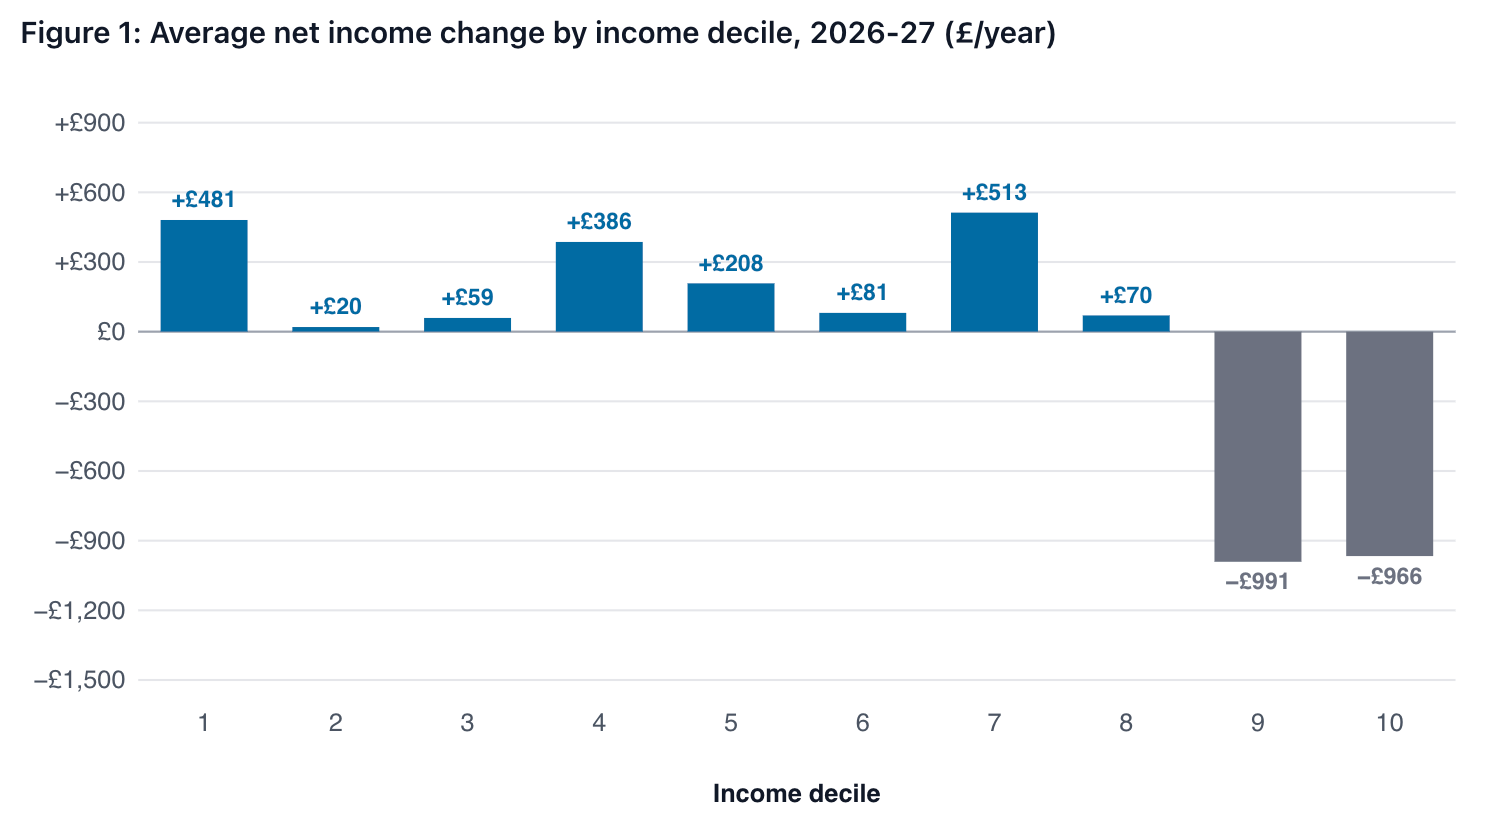
68% of households would have a higher net income. The bottom income decile (the poorest tenth) gains £481 a year on average; the ninth decile — the second-richest tenth — pays £991 more (the largest average cash loss), and the top decile pays £966 more.
Absolute poverty before housing costs falls by 0.65 percentage points.
The income Gini coefficient — the standard 0-to-1 measure of income inequality, where 0 means everyone has the same income and 1 means one household has it all — rises by just 0.11%. Measured income inequality barely changes even though most households gain, because the LVT redistributes along the wealth axis rather than the income axis. On that axis the gap is far starker: the Gini on household wealth is 0.70, against 0.37 for income.
Replacing council tax with a land value tax leaves most households better off and slightly lowers poverty, yet barely moves measured income inequality — because it taxes land wealth, which doesn’t line up neatly with income — which is exactly why the answer depends on which measure you use to judge a policy. If some of these results look contradictory or surprising, they did to us too; the rest of this post walks through how each measure is built and why they can point in different directions.
The model
We run this analysis with PolicyEngine UK, an open-source microsimulation, on Enhanced Family Resources Survey 2023-24 (FRS) microdata, which enables simulating policy impacts at the household level.[1]
First, we needed to recreate the council tax at the household level. FRS households report their council tax band (A–H, plus I in Wales). The survey asks for the gross annual tax bill; about a quarter of households give an amount. For the rest, we impute the mean of those reported amounts for the household’s region × band × single-person-status cell, which captures the band rate and the standard single-person discount. Council Tax Reduction (CTR) itself comes from FRS benefit responses — recipients tell the survey how much CTR they receive — and stays separate from the bill imputation. Because surveys like the FRS tend to undercount the very rich, the Enhanced FRS adds a set of synthetic high-income households. Each one is a copy of a real survey household whose incomes are replaced with values drawn from HMRC tax records (the Survey of Personal Incomes) by a quantile random forest — a machine-learning model — using age, sex, and region. These households enter with zero weight, and the calibration step then assigns them weights so the combined dataset reproduces official income totals, including at the very top.[3]
Following these steps, FRS-aggregated bills nevertheless fall short of published council tax totals. To resolve this, we calibrate household weights against the Valuation Office Agency stock-of-properties counts of dwellings by band and region (Scotland from the Scottish Government chargeable-dwellings dataset) and against Office for Budget Responsibility (OBR) council tax receipts. Northern Ireland doesn’t have council tax at all — it uses a separate “domestic rates” system, which we model on its own and leave untouched by this reform. (Northern Irish households still own land, so they would pay the new LVT on top of their unchanged rates bill.) The 2026-27 baseline this post replaces — gross billing minus CTR — is £57.6 billion, modestly above the OBR’s £53.7 billion accruals-basis forecast because PolicyEngine’s billing-side calibration matches dwelling stock counts and modelled CTR uptake rather than realised receipts.
On the land side, we need a land value for every household, and we build it up to match official national figures. The ONS National Balance Sheet[2] values all UK land at £7.10 trillion in 2024. In the model, each household’s property and land values grow with the OBR’s projected per-capita nominal GDP, and we calibrate household weights so the totals match the ONS series — giving a modelled UK land value of £7.46 trillion in 2026-27.
The model then splits this total across households in two parts. The larger part — £5.40 trillion — is land households own directly: for each household we take its current property value (imputed from the ONS Wealth and Assets Survey) and multiply by a region-specific “land share” — the fraction of a property’s value that is the land underneath rather than the bricks and mortar. That share is highest in expensive regions (around 85% in London) and lowest in cheaper ones (around 42% in the North East). The remaining £2.06 trillion is land owned through companies; because people ultimately own those companies, we hand this corporate land to households in proportion to their corporate wealth — the stocks, funds, private pensions, and corporate bonds each household holds. Finally, we calibrate the household survey weights so these land values reproduce the ONS’s national and regional totals.
Ultimately, this produced a household-level estimate of tax bills under the current council tax and a land value tax which enables our model to calculate distributional impacts of a shift to land value tax. The model reports revenue, distributional, poverty, and inequality outcomes at any LVT rate, for every income decile and family type. All figures cover the 2026-27 fiscal year (April 2026 to March 2027).
Where land value sits
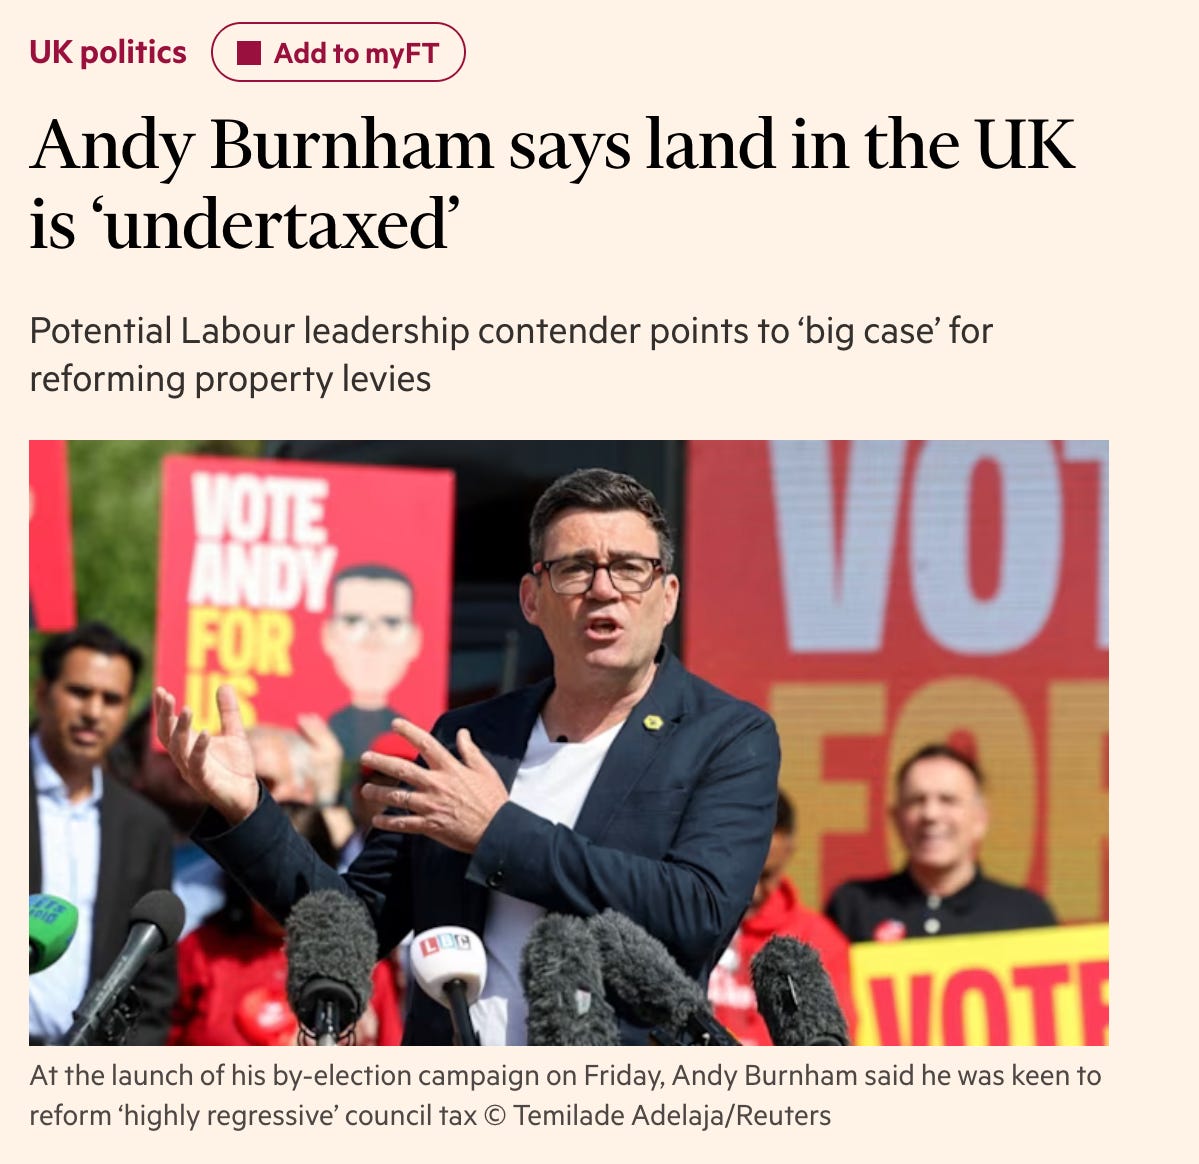
Land value sits unevenly across UK households—rising from £127,000 in the bottom income decile to £443,000 in the top. The three figures below, by income decile, by region, and by household type, set up every distributional result that follows.
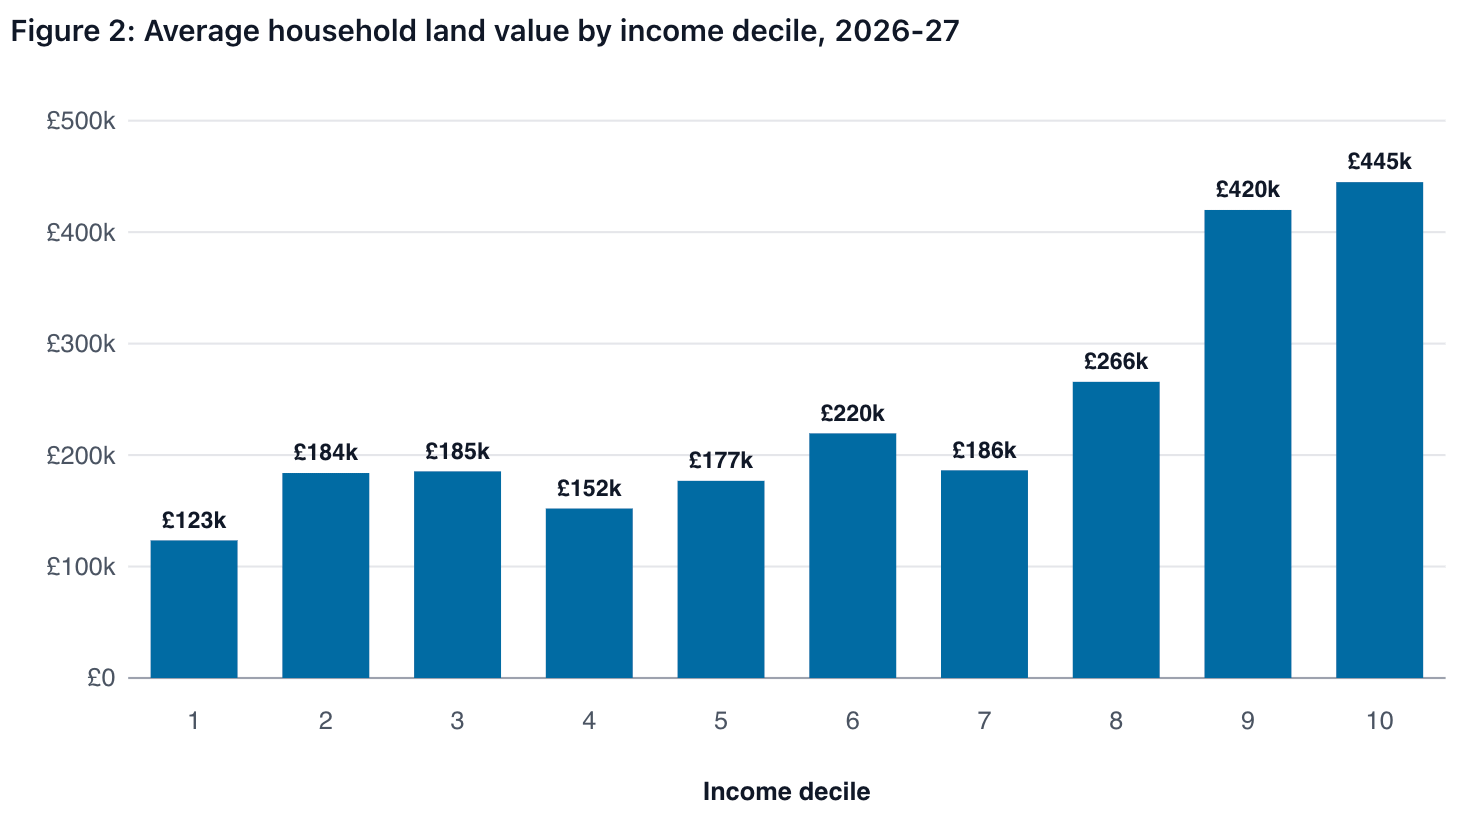
Households in London hold £370,000 of land on average, while those in the North East and Scotland hold around £154,000–£160,000. A flat UK-wide LVT redistributes land-tax burden geographically by construction, since current land prices vary so much across the four nations and the English regions.
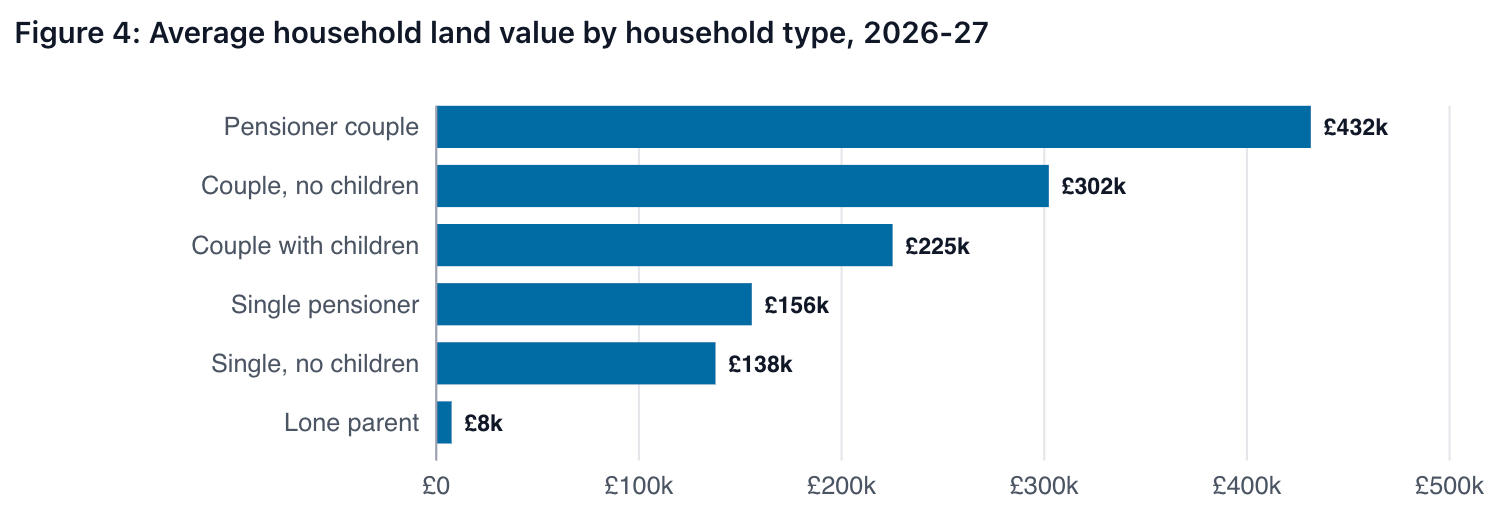
By household type, pensioner couples hold the most land on average (£431,000); lone parents the least (£8,000). The pensioner-couple result reflects long-tenure homeownership: many of these households bought decades ago and own outright. Averages here include corporate land that the model attributes to households through corporate wealth.
The reform
The reform abolishes council tax across Great Britain and replaces it with a flat LVT on all UK land value at the rate that holds aggregate council tax revenue constant. Northern Ireland’s domestic rates remain in place; Northern Ireland households therefore face the land value tax on top of their unchanged rates bill. The LVT applies to all land, including the £2.06 trillion held through the corporate sector, so commercial land contributes alongside residential, while business rates on commercial property also stay in place. For working out who gains and who loses, we assume the new tax is paid by whoever owns the land today. A household pays directly on the land it owns, and on its share of company-owned land it pays indirectly — the cost comes out of the value of the shares and pensions it holds. (This is the immediate, “first-round” effect: we don’t try to model how things adjust later on, such as land or rent prices shifting — more on that near the end.) Nothing else in the tax-and-benefit system changes.
Abolishing council tax retires the Council Tax Reduction rebate alongside it — there is no council tax for CTR to rebate. Households that currently receive CTR therefore lose the rebate when they lose the bill, and their out-of-pocket position changes by net council tax minus LVT.
Revenue and rate sensitivity
PolicyEngine UK estimates £57.6 billion per year from current council tax (net of Council Tax Reduction). Dividing that by £7.46 trillion of UK land value gives the budget-neutral rate of 0.77%. Table 1 reports outcomes at three illustrative rates: 0.5%, 0.77%, and 1.0%.
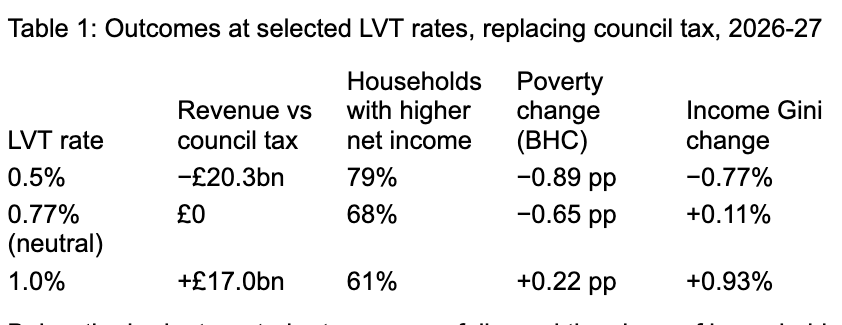
Below the budget-neutral rate, revenue falls, and the share of households with higher net income rises. At 0.5%, the model raises £20 billion less than the current council tax, and 79% of households gain. Above the budget-neutral rate, revenue rises, and the share of gainers falls. At 1.0%, the reform raises £17bn more and 61% gain. We hold the rate range to 0.5%–1.0% because the static model assigns the first-round burden to current landowners and does not capture land-price capitalisation, rent pass-through, or behavioural responses, all of which matter more at higher annual rates.
For context, PolicyEngine projects a baseline 2026-27 Gini coefficient on income of 0.37, while the Gini on household total wealth is 0.70. Wealth in the UK is far more concentrated than income; the static model leaves wealth stocks unchanged under the reform.
Impact by income decile
Table 2 reports the average household impact at the budget-neutral 0.77% rate: average council tax today, the LVT replacement bill, the change in household net income, and the same change as a share of household net income (post-tax-and-benefit, not equivalised). The change in net income exceeds the simple LVT−council-tax difference because abolishing council tax also clears the means-tested benefit interactions that current bills create — the columns therefore won’t subtract exactly.
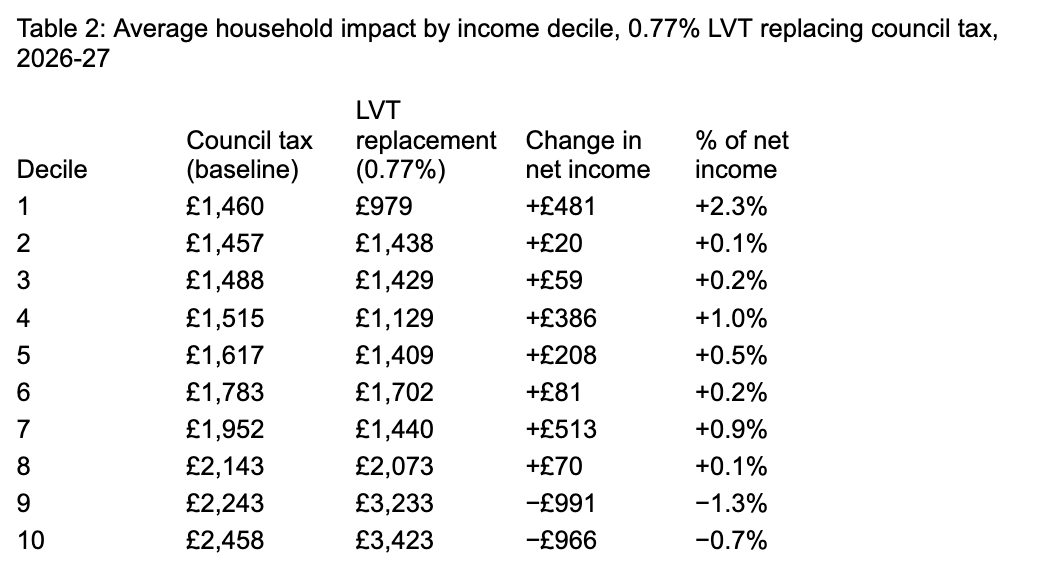
Every income decile from 1 through 8 gains on average; only deciles 9 and 10 lose. The bottom decile gains £481 a year (2.3% of net income); decile 9 takes the largest cash loss at £991 (1.3% of net income), with the top decile paying £966 more (0.7% of net income). The pattern across the lower deciles is uneven because income and land holdings are imperfectly correlated: even where the average gains, a high-land minority within the decile pays more under the LVT than under the current council tax (the surveys we draw from may also carry reporting and/or measurement error). Figure 1, at the top of the post, plots this impact in pounds per year.
Across all households, 68% have higher net income at the budget-neutral rate. Absolute poverty before housing costs falls by 0.65 percentage points. The income Gini coefficient edges up by just 0.11% — essentially flat, though still in the opposite direction of the headline gain pattern. The mechanism: LVT redistributes along the wealth axis, not the income axis, so within every income decile, land-rich households (often older homeowners with paid-off properties) pay much more while land-poor households (renters, recent buyers) pay less. That within-decile crisscrossing barely shifts the overall income spread, even as decile averages move progressively.
Same reform, by wealth decile
Wealth deciles cut the same simulation along a different axis. Figure 5 plots the average net income change at the 0.77% LVT by household wealth decile rather than income decile.
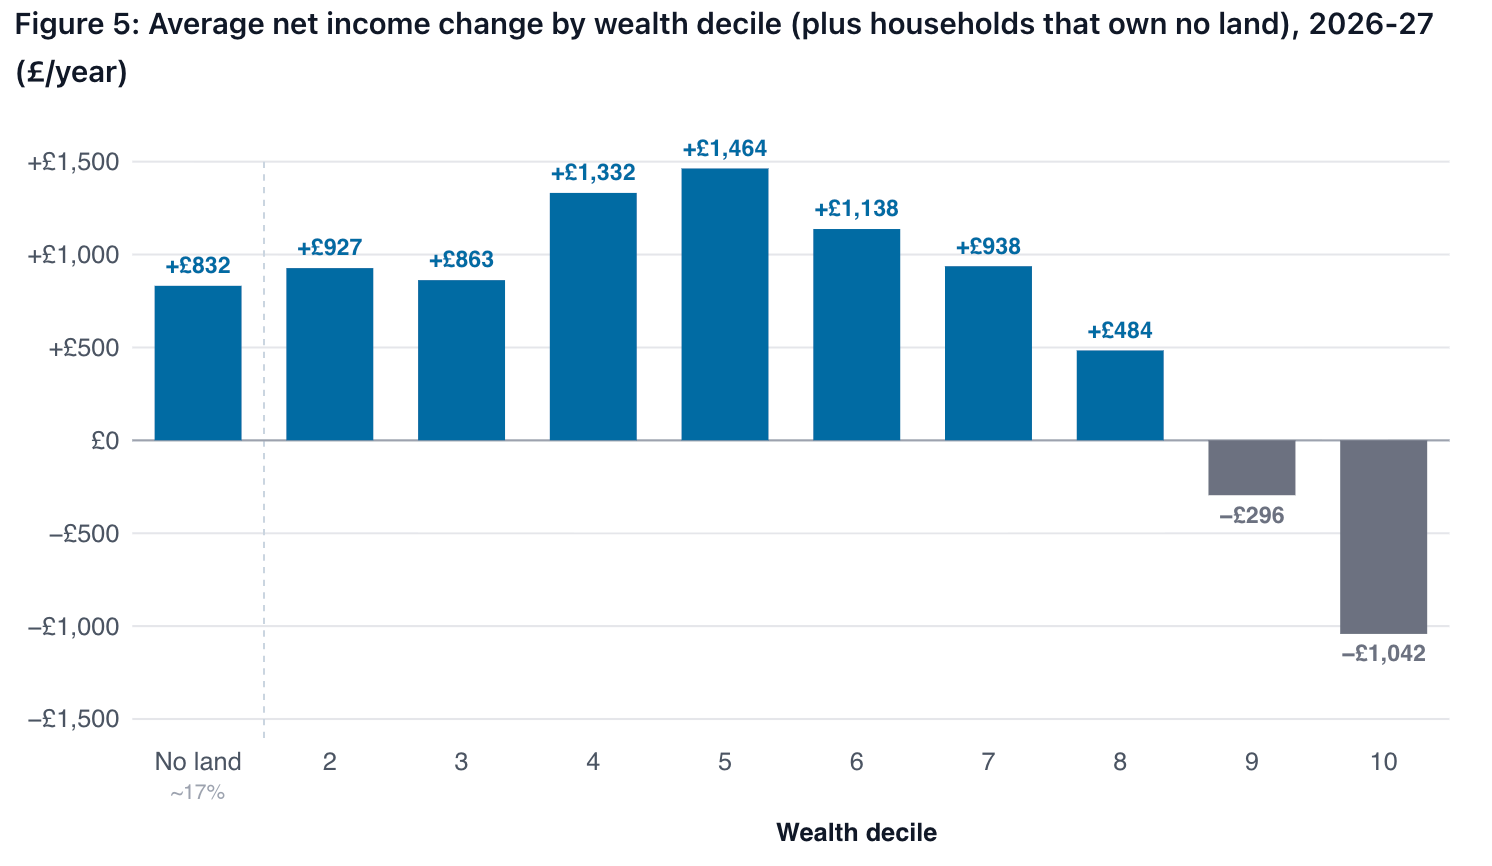
The wealth-decile picture is cleaner than the income-decile one. Wealth deciles 2–8 all gain (between £484 and £1,464 a year on average); only deciles 9 and 10 lose, with the top wealth decile paying £1,042 more on average, comparable to the £966 average loss for the top income decile. (The leftmost bar, set apart from the deciles, is the roughly 17% of households that own no land at all. A pure wealth-decile cut can’t place them cleanly — many share an identical zero wealth — so we show them as their own category. Because they pay no LVT and keep their council-tax saving, they gain about £832 a year on average, and around 82% are better off.) The reform is, by construction, a tax on land wealth. It lands progressively along the wealth distribution even when the income-decile pattern is noisier. And as a tax on a form of wealth, some may be more interested in the wealth axis. Wealth in the UK is far more concentrated than income — a wealth Gini of 0.70 against 0.37 for income — so a tax tied to land wealth falls where that concentration is greatest. On this axis the burden rises consistently with wealth, where the income-decile pattern did not: the wealthiest tenth pays £1,042 more a year on average (a 43% increase), while the middle of the wealth distribution gains.
The Mirrlees Review and the Fairer Share proposal both discuss deferral mechanisms (letting households accrue the LVT charge against the property until sale or inheritance) as one design response for the income-poor, land-rich households that the income-decile averages obscure. While PolicyEngine UK can score some of these designs such as age-based reliefs or income-tested reductions, we exclude them for this analysis.
Who gains and loses, within deciles
Decile averages hide variation within deciles. Figure 6 reports the share of households with higher, lower, or unchanged net income at the 0.77% rate, by income decile.
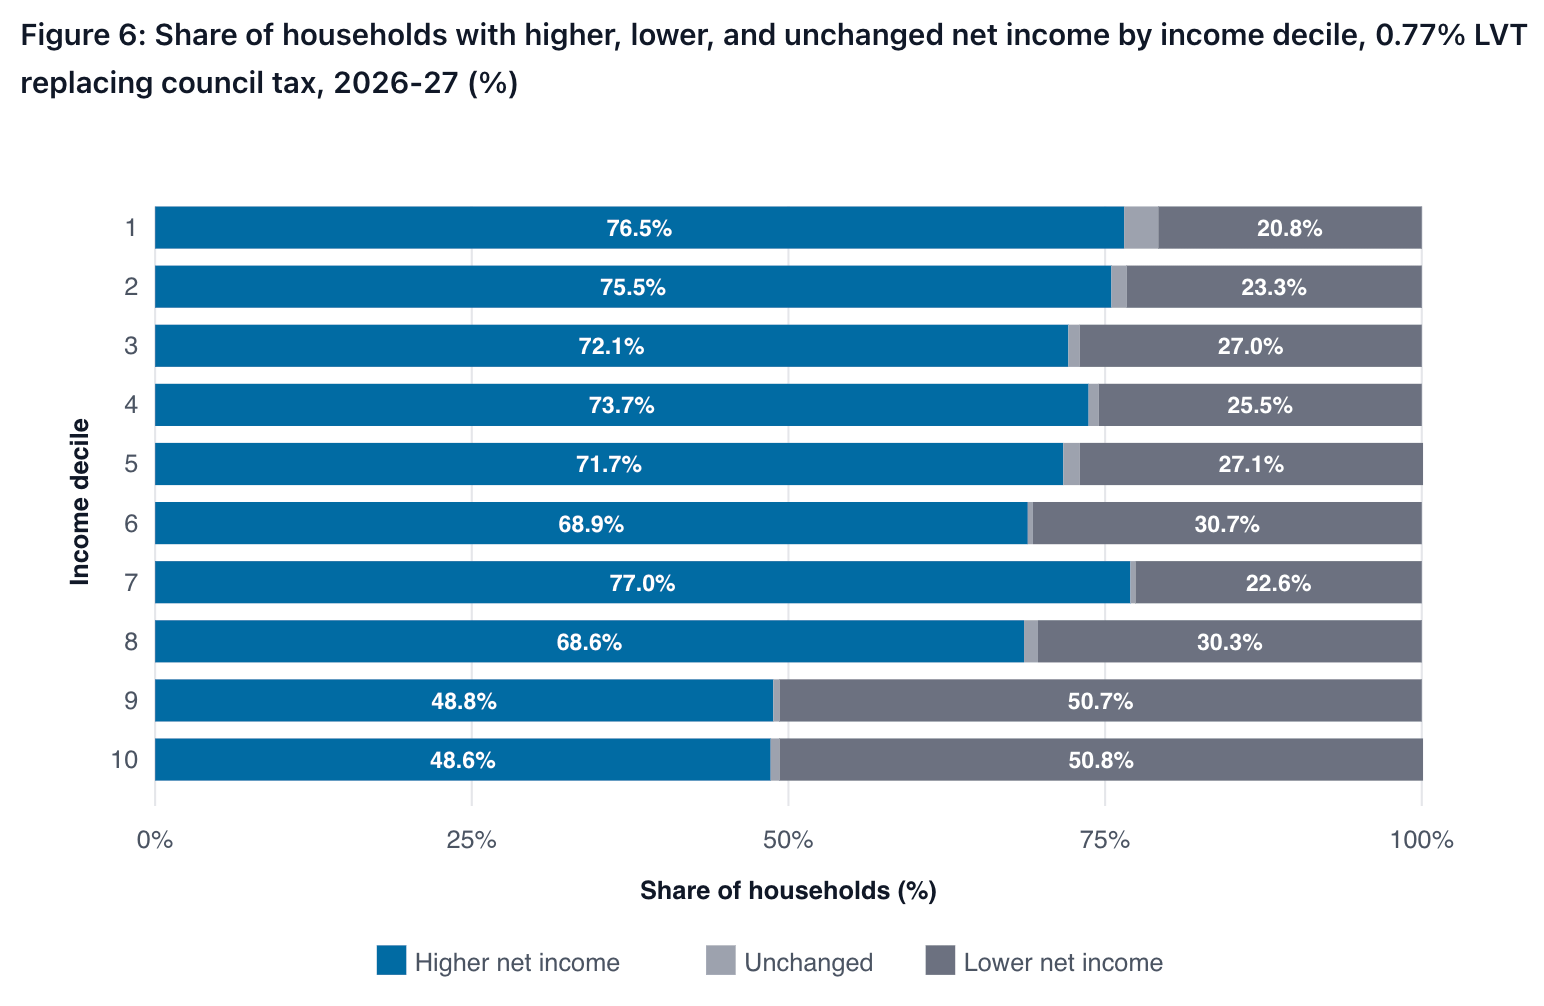
In the top decile, 49% of households still have higher net income, despite the average loss of £966; in the bottom decile, 21% have lower net income, despite the average gain of £481. The share of losing households is around 21–27% in deciles 1–4 and climbs to roughly half by deciles 9 and 10, with non-monotonic dips in between. The same high-land-value, lower-income households visible in the loss share across deciles 1–8 are the group most LVT designs target with deferrals or transitional protection.
What this model doesn’t capture
The static model assigns the first-round LVT burden to current landowners (directly for household-held land, indirectly via corporate equity for corporate land), and holds everything else constant. It does not model land-price capitalisation — the standard result that a recurring land tax is gradually capitalised into lower land prices (Mirrlees Review). Because land is concentrated near the top of the wealth distribution, this would push measured wealth inequality down over time, but its size and timing are outside the static model's scope. Nor does it capture rent pass-through to tenants; behavioural responses in land use and development decisions; or the redesign of devolved local-government funding that any reform would require. The model also abstracts from implementation: who values the land, how often, and how to resolve disputes. And because LVT depends on land value rather than income, replacing council tax with an LVT removes the income-tested phase-out that CTR imposes on low-income households, reducing their effective marginal tax rates — an incentive effect the static model does not score.
Each is a model extension, not an alternative analysis, and we at PolicyEngine are investigating several: fuller local-authority calibration; capitalisation modelling that tracks burden over time; transitional designs (deferrals, phased introduction, age- or income-based protection); and rent-pass-through under alternative supply-elasticity assumptions.
Using the model
PolicyEngine UK is open source. The model scores specific designs (phased introduction, pensioner deferrals, multi-rate by region, alternative bases) in the same format as this analysis. The code and underlying data are public, and anyone can reproduce these results.
Notes
PolicyEngine UK version 2.88.20; PolicyEngine Python client v4.4.2; Enhanced Family Resources Survey 2023-24, calibrated as of May 2026.
ONS National Balance Sheet series AN.211 (non-financial assets — land).
The quantile random forest is trained on HMRC’s Survey of Personal Incomes (SPI) and predicts six income components (employment, self-employment, private pension, property, savings interest, and dividend income) from age, sex, and region. The synthetic households keep their source household’s other survey responses — including reported benefits such as council_tax_benefit_reported — unchanged. See the imputation code in policyengine-uk-data.
Code and reproducible results: github.com/PolicyEngine/uk-land-value-tax. Vahid Ahmadi is a Research Associate at PolicyEngine; Max Ghenis is the founder and CEO. PolicyEngine is an open-source non-profit that builds tax and benefit policy models. Contact: vahid@policyengine.org, max@policyengine.org.
 | A guest post by
|
 | A guest post by
|
I was in the Land Value Campaign when we supported an exercise of this kind in 2005. Against our better judgement, we agreed that the valuations should be based on selling prices and not on gross annual rental values. Long story sort - the results got the proposal shot down in flames.
LVT must be assessed on gross annual values. Existing property taxes payable must be added to the net annual value. Same as the business rates before 1988.
A 1% rate of tax corresponds to a rate of about 20% on gross annual value. Land Value Taxes based on selling prices are set up for failure.
It is hard to see the political viability of a policy that leaves 30% of households worse off. The 20% of land rich households in the bottom decile will be used to hijack the narrative. It is also hard to see the viability of a proposal that has London land values used to subsidise local authority profligacy in low land value areas like the north.